Early-grade proficiency in context
Keene · Merrimack · Hudson · Oyster River · Brentwood | Grades 3–4 math and reading | November 17, 2026
Merrimack consistently falls below the lunch-eligibility reference line. This holds in all four pooled comparisons and when any one of 2023–25 is omitted. The result is a persistent descriptive signal; it does not isolate school or curriculum effects.
| 2023–25 pooled | Lunch eligible | G3 math | G3 reading | G4 math | G4 reading |
|---|---|---|---|---|---|
| Keene | 31.7% | 59.2% | 52.4% | 54.8% | 53.7% |
| Merrimack | 9.3% | 59.5% | 53.7% | 51.3% | 56.9% |
| Hudson | 16.3% | 53.0% | 50.7% | 54.7% | 56.7% |
| Oyster River | 8.4% | 74.2% | 73.3% | 71.5% | 72.6% |
| Brentwood | 8.7% | 84.4% | 76.9% | 74.2% | 71.4% |
Five districts, three comparison roles. Oyster River and Brentwood have similar eligibility and higher proficiency. Keene has higher eligibility and similar proficiency. Hudson adds an intermediate-eligibility comparison with similar proficiency and enrollment size, closer to all four reference lines. Merrimack’s pooled results are 3.7, 5.7, 11.2 and 5.0 percentage points below the respective fitted lines. These are lunch-adjusted comparisons, with other socioeconomic factors still unadjusted.
The comparison persists across years
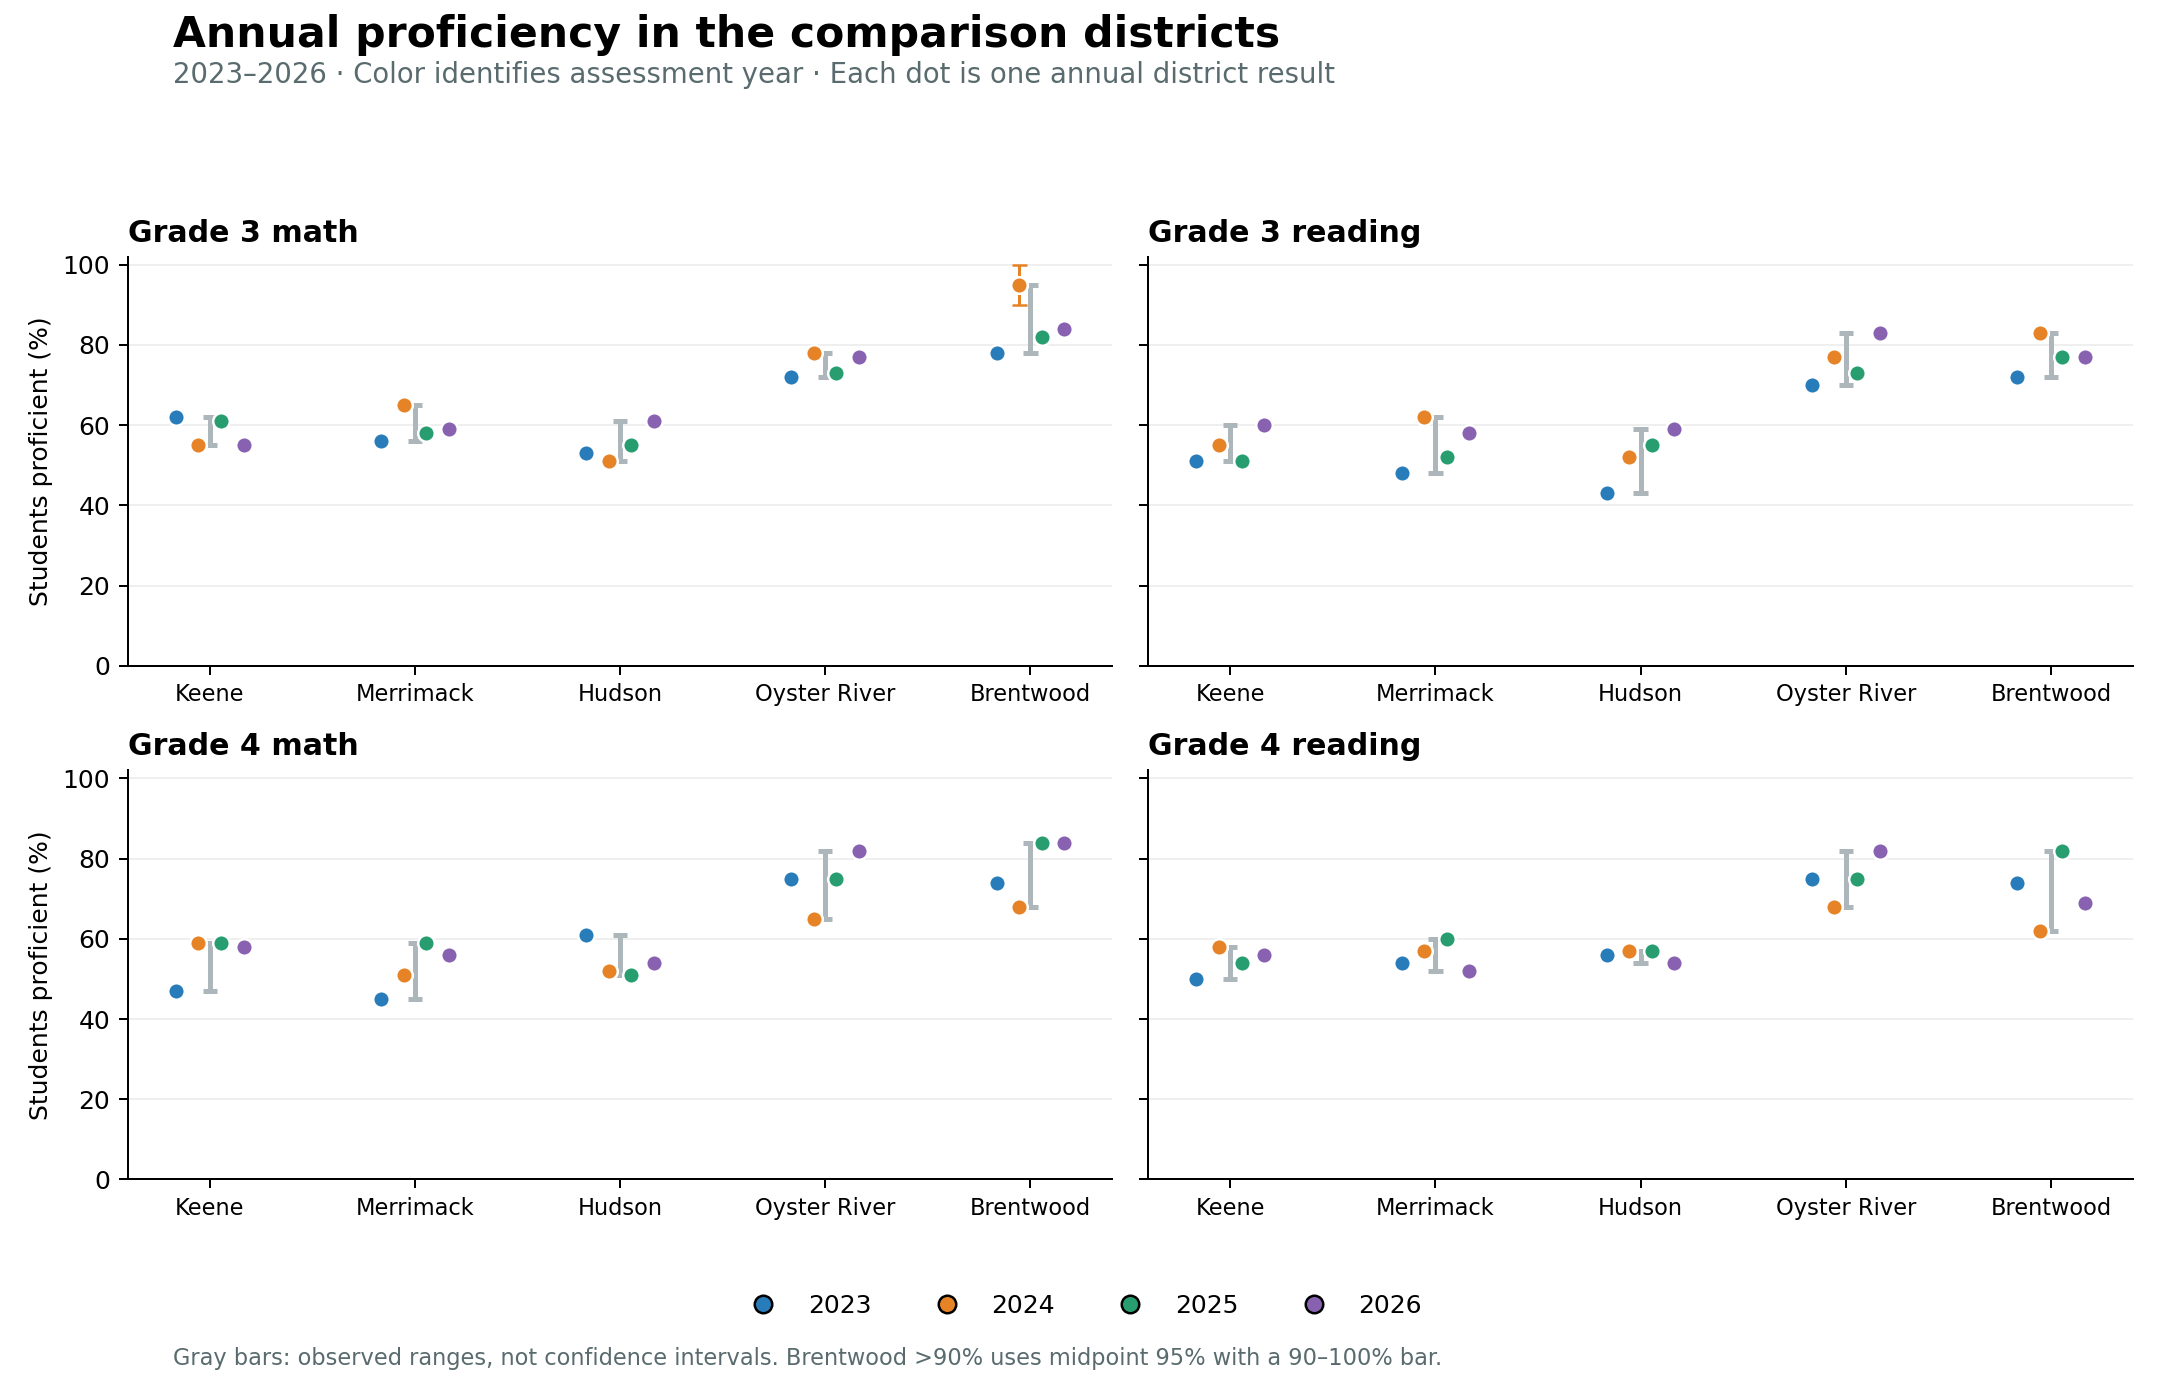
The same five districts appear in both graphics. Color identifies the assessment year; gray bars show observed ranges.
What the annual results support
Oyster River is consistently higher. It exceeds Merrimack in all 16 matched grade/subject/year results from 2023–26, by 11–30 percentage points. Its lowest annual result exceeds Merrimack’s highest in each panel. This separation is more persuasive than any one year’s score.
Brentwood adds a second vertical comparison. It exceeds Merrimack in all 16 matched annual results. Its smaller groups (roughly 40–60 tested students) warrant caution. Annual ranges remain separated in all four panels.
Keene consistently overlaps Merrimack. Eleven of 16 matched annual results are within 5 points; all are within 10. The mean absolute gap is 3.9 points. Keene is the closest annual match among the 90 included districts with lunch eligibility at least 10 points above Merrimack’s. Comparator selection used these four years retrospectively.
Hudson adds an intermediate comparison. Its 16.3% lunch eligibility lies between Merrimack (9.3%) and Keene (31.7%), short of their 20.5% midpoint. Pooled proficiency is within 0.2–6.5 points of Merrimack across all four panels; observed 2023–26 ranges overlap in each. Hudson is closer to every fitted line, with residuals of −4.7, −3.2, −1.9 and +0.5 points (G3 math, G3 reading, G4 math, G4 reading). Mean operated enrollment is 2,998 versus Merrimack’s 3,517; average tested groups are 196 versus 250 in 2023–25. This is a descriptive size and outcome comparison, not evidence of equivalent schools.
How much movement is ordinary?
| District tested group | Paired changes | Median absolute swing | 80% within | 95% within |
|---|---|---|---|---|
| 20-49 | 185 | 10 pp | 18.2 pp | 30.0 pp |
| 50-99 | 287 | 6 pp | 13.0 pp | 18.0 pp |
| 100-199 | 148 | 5 pp | 10.0 pp | 15.0 pp |
| 200+ | 90 | 3 pp | 7.0 pp | 10.6 pp |
These are historical year-to-year changes after subtracting the statewide grade/subject change. Merrimack’s district tested groups are roughly 230–270 students; Hudson’s are roughly 160–230, and Keene and Oyster River are smaller. The bars in the graph show observed four-year ranges, not confidence intervals. Neither ranges nor annual-change percentiles yield a “correctness percentage.”
Implication. Merrimack remains below the reference in all four 2026 refits. Stability supports further investigation of the gap; it does not identify its cause.
Does lunch eligibility fit the communities?
It is a defensible indicator of low-income enrollment, but an incomplete measure of socioeconomic context. Census data support the contrast with Keene and show how Hudson, Oyster River and Brentwood differ from Merrimack on other dimensions.
Community context: ACS 2020–2024 five-year estimates [1–3, 11–12]
| Community area | Population | Median household income | Median owner home value | Adults 25+ with BA or higher |
|---|---|---|---|---|
| Keene | 22,939 | $78,445 | $252,500 | 44.1% |
| Merrimack | 28,164 | $127,219 | $458,600 | 50.3% |
| Hudson | 25,557 | $124,213 | $438,900 | 34.2% |
| Oyster River | 21,859 | $127,379 | $493,000 | 63.5% |
| Brentwood | 4,641 | $165,509 | $528,100 | 49.0% |
Community residents, not enrolled students. Income and housing values are medians, not means. Home values describe owner-occupied homes, not all property. ACS margins of error appear in the appendix.
A closer check on the lunch denominator
| 2023–25 pooled eligibility | Keene | Merrimack | Hudson | Oyster River | Brentwood |
|---|---|---|---|---|---|
| All operated schools | 31.7% | 9.3% | 16.3% | 8.4% | 8.7% |
| Schools serving grades 3 or 4 | 40.4% | 10.1% | 17.7% | 8.2% | 8.7% |
The elementary check uses all enrolled grades within schools serving grade 3 or 4; grade-specific eligibility is unavailable. The ordering persists. Keene’s higher elementary eligibility also shows why district grade composition matters.
Keene: lower household income and owner home values align with its higher lunch eligibility. Its outcomes nevertheless overlap Merrimack’s. The city comparison is approximate: Keene schools also enroll tuition students from other communities, including Surry at elementary level. [7]
Merrimack and Oyster River: median household incomes are virtually identical ($127,219 and $127,379), well within their sampling margins. Home values are closer than either is to Keene’s. However, adults with a bachelor’s degree or higher account for 50.3% in Merrimack and 63.5% in Oyster River. Lunch eligibility misses this dimension; resident adults are not necessarily parents of tested students. [2–3]
Brentwood: adult degree attainment is 49.0% (±7.4 points), close to Merrimack’s 50.3%. Higher proficiency therefore also appears in a comparator with similar adult education. However, its median household income is higher ($165,509 versus $127,219), so this does not isolate a school effect. [11]
Hudson: its population (25,557) is about 9% below Merrimack’s. Household income ($124,213 ± $6,061) and owner home value ($438,900 ± $10,771) are similar in scale to Merrimack, while adult BA+ attainment is lower (34.2% ± 3.2 points versus 50.3% ± 3.2). These differences reinforce that lunch eligibility alone does not fully adjust socioeconomic context. [12]
College-town caution. Durham’s all-person poverty rate is 15.1%, which cannot be read as the poverty rate of school families. Census explains how off-campus college students can raise a community’s reported poverty rate. Lunch eligibility is more directly tied to enrolled children, although administrative reporting and applications still affect it. [4, 9]
Next steps · Compare instructional and student factors
1. Build a five-district comparison. Confirm grade 3–4 reading and math programs, adoption years, implementation, instructional time and intervention supports through district documents and staff follow-up. Record program changes by school year; curriculum names alone are insufficient.
2. Add context. Gather comparable annual measures of attendance, disability and English-learner enrollment, class size and staffing, alongside lunch eligibility and adult education. Document missing data and differences in definitions.
3. Test the patterns. Compare matched grade/subject trends around documented program changes; expand beyond these five districts for adjusted analysis. Produce a sourced comparison table and timeline. Treat any curriculum association as exploratory, without attributing score gaps to a program.
Appendix A · Methodology
Assessment panel and lunch join
Use district aggregate grade 3/4 math and reading results from Consolidated Assessment History 2026, Base Data. The common 2023–25 panel has 90 districts, including two charters, with all 12 required cells, observed lunch data in all three years, at least 20 tested students per cell using the reported count-range lower bound, and at least 90 test events pooled per grade/subject. Sequential exclusions from 174 candidates: 7 missing cells, 4 missing observed lunch data, 34 unavailable/small-count suppressed proficiency, and 39 below count thresholds.
Lunch counts come from NCES CCD/EDGE school administrative records for 2022–23, 2023–24 and 2024–25, aligned to assessment ending years 2023, 2024 and 2025. Sum free/reduced-price eligible counts and MEMBER enrollment across operated schools and years, counting each district-year once. Enrollment can include preschool and tuition students; it is not town population or the tested cohort’s individual eligibility. No imputed gap-year lunch rates enter this report. The elementary sensitivity retains schools serving grade 3 or 4 and recomputes the same ratio. Hudson’s Hills Garrison and Nottingham West schools are identified from grade 3/4 assessment records; their observed NCES membership and eligibility are counted once per school-year. The supplemental Hudson rows cover these two elementary schools; all-operated-school Hudson totals come from district-level records.
Pooling, reference lines and sensitivity checks
Weight annual proficiency by midpoint tested counts. Percentages reported as >90 or <10 use midpoints 95 or 5, carrying bounds 90–100 or 0–10 into plotted uncertainty bars. Nine included annual cells are censored; one is Brentwood grade 3 math in 2024 (>90%). Fit ordinary least squares separately for each grade/subject, giving each district equal weight. Correlations in the pooled panels range from −0.67 to −0.76. These are ecological associations, not causal effects or tests of individual students.
Leave-one-year-out fits preserve Merrimack’s negative residual in all 12 checks. Annual association checks use fixed 2023–25 lunch eligibility through 2026; 2026 lunch data are unavailable. The 2026 outcomes were absent from the original pooled fit but were used in comparator selection, so they are not independent validation of the selected comparators. Excluding censored points and raising the pooled minimum to 150 both retain the negative association.
Annual stability and comparator selection
Calibrate movement using 710 paired district changes and 1,268 school changes, from 2023→24 and 2024→25, within the original 90 districts. Require unsuppressed numerical proficiency and tested-count lower bounds of at least 20 at both endpoints. Subtract the statewide change for the same grade and subject; group size uses the harmonic mean of midpoint counts. Only 12 districts contribute to the 200+ band, so tail percentiles are approximate. Overlapping changes are not independent. Movement includes real learning, cohort composition, participation and measurement effects; it is not an estimate of individual test measurement error.
Choose Keene by minimum root mean squared matched annual proficiency gap among included districts at least 10 eligibility points above Merrimack, using all 16 cells in 2023–26. Oyster River is a primary higher-proficiency comparison with similar eligibility and larger tested groups than smaller candidate benchmarks. Brentwood is an additional similar-eligibility, higher-proficiency comparator with smaller tested groups. Hudson was added after screening included districts between Merrimack and Keene on pooled lunch eligibility for proximity to the eligibility midpoint, similar pooled proficiency, size and proximity to the four original fitted lines. Hudson prioritizes size over an exact midpoint: Mascenic Regional is nearer the midpoint but has much smaller tested groups. Hudson was already in the 90-district fit; highlighting it does not change the reference lines. Enrollment size is mean operated membership across 2023–25; tested size averages midpoint counts across the 12 grade/subject/year cells, not unique students. Its 2026 results were inspected during selection. All selections are descriptive and retrospective. Display each year as a separate colored dot and the observed range as a gray bar; no inferential confidence bands are implied.
Community interpretation
Use ACS 2020–2024 five-year community estimates, a multiyear context window rather than annual or school-family data. Use the directly published Oyster River district geography; do not average town medians. Household income, owner housing values and adult degree attainment measure different dimensions and are not combined into a new wealth score. Keene’s tuition catchment and Oyster River’s high-school tuition arrangements limit alignment between Census residents and all-grade enrollment. No statistical proxy validation across all 90 districts or multivariate adjustment has yet been performed.
Appendix B · Estimates and sources
ACS margins of error below are published 90% margins. Monetary estimates are in 2024 dollars. BA+ describes adults age 25 and older. Small-community estimates can be imprecise; the nearly identical Merrimack/Oyster income point estimates should not be ranked.
| Community | Median household income ± MOE | Median owner home value ± MOE | BA+ share ± MOE |
|---|---|---|---|
| Keene | $78,445 ± $8,109 | $252,500 ± $12,011 | 44.1% ± 3.4 pp |
| Merrimack | $127,219 ± $16,220 | $458,600 ± $15,424 | 50.3% ± 3.2 pp |
| Hudson | $124,213 ± $6,061 | $438,900 ± $10,771 | 34.2% ± 3.2 pp |
| Oyster River | $127,379 ± $13,367 | $493,000 ± $20,048 | 63.5% ± 5.0 pp |
| Durham | $124,056 ± $21,086 | $504,300 ± $40,671 | 75.5% ± 5.6 pp |
| Lee | $131,579 ± $54,001 | $480,600 ± $61,344 | 50.6% ± 8.8 pp |
| Madbury | $148,365 ± $30,043 | $476,900 ± $30,791 | 52.6% ± 6.3 pp |
| Brentwood | $165,509 ± $23,185 | $528,100 ± $74,929 | 49.0% ± 7.4 pp |
Sources and reproducibility
[1] Census Reporter, Keene profile, ACS 2024 five-year release (2020–2024). Population: B01003; household income: B19013; owner home value: B25077; adult education: B15002. Accessed November 17, 2026.
[2] Census Reporter, Merrimack profile, ACS 2024 five-year release (2020–2024). Population: B01003; household income: B19013; owner home value: B25077; adult education: B15002. Accessed November 17, 2026.
[3] Census Reporter, Oyster River profile, ACS 2024 five-year release (2020–2024). Population: B01003; household income: B19013; owner home value: B25077; adult education: B15002. Accessed November 17, 2026.
[4] Census Reporter, Durham profile, ACS 2024 five-year release (2020–2024). Population: B01003; household income: B19013; owner home value: B25077; adult education: B15002. Accessed November 17, 2026.
[5] Census Reporter, Lee profile, ACS 2024 five-year release (2020–2024). Population: B01003; household income: B19013; owner home value: B25077; adult education: B15002. Accessed November 17, 2026.
[6] Census Reporter, Madbury profile, ACS 2024 five-year release (2020–2024). Population: B01003; household income: B19013; owner home value: B25077; adult education: B15002. Accessed November 17, 2026.
[11] Census Reporter, Brentwood town profile, ACS 2024 five-year. Same tables and access date as [1–6].
[12] Census Reporter, Hudson town profile, ACS 2024 five-year. Same tables and access date as [1–6].
[7] Keene School District and Surry School District. Source; additional district detail.
[8] Oyster River Cooperative School District, About. Source; additional district detail.
[9] U.S. Census Bureau: college students and community poverty. Source.
[10] U.S. Census Bureau: ACS five-year data and documentation. Source.
Assessment and lunch sources: Consolidated Assessment History 2026.xlsx and NH_Assessments_With_Lunch_Eligibility.csv; NCES CCD/EDGE school administrative datasets, 2022–23 through 2024–25. Existing NH_District_Comparison_Data.xlsx and NH_Proficiency_Stability_Data.xlsx retain the full comparison panel and stability calculations. Supplemental CSV files record the Census context, elementary lunch denominator check and selected annual results.
Scope: community context supports a cautious interpretation of the lunch indicator, not proof that it fully controls socioeconomic differences. School curriculum, attendance, disability, language needs, participation and family-level resources remain unadjusted.